What is regression and Game Score and why should it matter in handicapping? Let’s get some definitions we can work with. First is for regression. I am using the terminology of “regression to the mean”. This is copied directly from a Google search. “In statistics, regression toward (or to) the mean is the phenomenon that if a variable is extreme on its first measurement, it will tend to be closer to the average on its second measurement—and if it is extreme on its second measurement, it will tend to have been closer to the average on its first.” Think in terms of outliers. Going in the direction more extreme than another, the outlier is not the mean (average bar). Humans are not machines and have progression and regression toward the mean. If we could gauge or even predict those “outliers”, then we could bet on those opportunities they present.
What is Game Score? The next few lines are copied directly from Fangraphs. “Game Score was originally created by Bill James to measure the quality of individual starts.” “Calculating Game Score (original or v2) is extremely simple, requiring some basic addition, subtraction, and multiplication. The original Game Score is calculated like this:
Game Score = 50 + Outs + 2*(IP Completed After the 4th) + Strikeouts – Hits – 4*Earned Runs – 2*Unearned Runs – Walks”
Game Score tries to answer the fundamental question, “how good was that start?
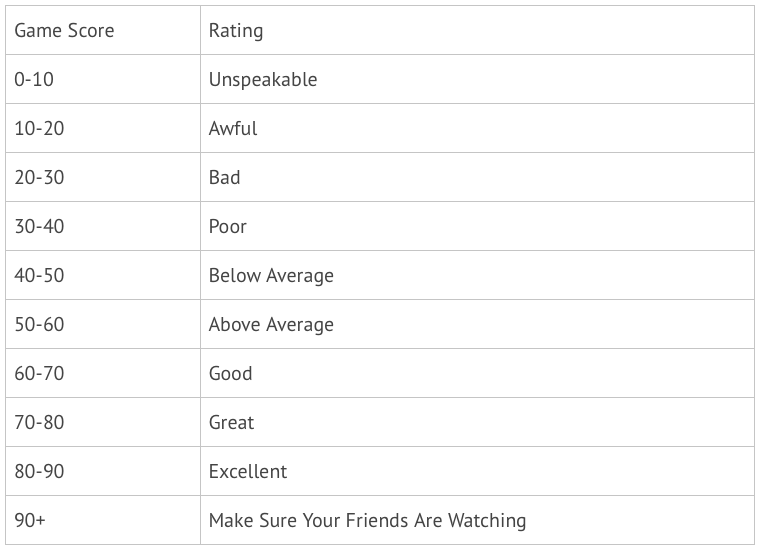
Game Score Rules of Thumb

Fundamentally, it is important use Game Score because the Win stat for a pitcher does not indicate the performance of the pitcher nor if the performance was above or below mean average.
Most successful gamblers are good at spotting patterns. This is a skill vital to seeing opportunities when others are not even looking. Regression or progression outliers make patterns. We can somewhat predict these patterns with reasonable expectancy. Here is where Game Score comes in. Examples of patterns I am referring to. Starting pitchers earn a GameScore for every game in which they start. As we determine a pitcher’s average GameScore over the course of the season, we will see above and below average GameScore results. We will be estimating future performance based on the patterns created by the outliers in GameScore. Now let’s put this into practice to discover some patterns.
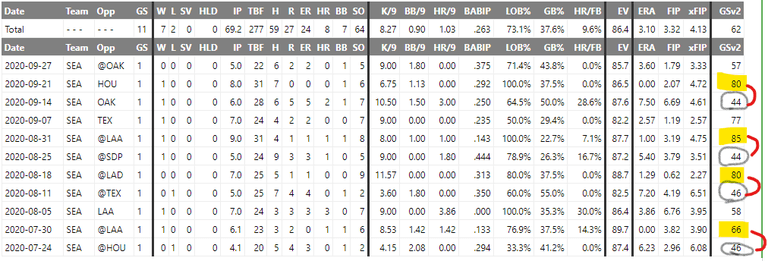
This chart is of SEA Marco Gonzales (picked random) and is his Game Log. If you are not looing at Game Logs, you are missing important opportunities. We are going to look at the last column GSv2. This is GameScore Version 2. We can see his Total (YTD) was 62 which is above average and for a season is particularly good!

I made some edits on the chart. Circles are well below average outliers, and highlighters are well above average outliers. The log flows bottom to top. We see his 1ststart was a GSc 46. His avg GSc in 2019 was 53 so he is below his normal performance while establishing a new 2020 GSc average. We should expect his GSc46 to be an outlier low, so his next start should either be an average start or an outlier high to get his average back to the mean. In this case, he threw a GSc66. A particularly good outing. His GSc after two games is 56 and above average. This was a good outcome for SEA. Gonzales was on the road against Dylan Bundy, and he was a +162 underdog. SEA won the 8-5. We assumed Gonzales would throw well and he did. We were not sure if he was going to be an outlier high, but his average to the mean left us those two options. His 3rd start was a GSc58 which was his average which again would be expected. We cannot do much else with Gonzales now until he has another outlier. It came on 08/11 against TEX. He threw a GSc 46 and is an outlier low. We now know he should throw well his next time out. On 08/18 he did just that. He threw his best game season to date a GSc80. You can see how these patterns build and for Gonzales it was quite easy as he threw an outlier high off an outlier low all season.
Experience teaches us many things. My experience with this has taught me several nuances. First, this is a great early season betting strategy. I have written the past articles referencing early season betting, and this is the premise of it. Second, when trying to figure out when a pitcher will throw bad or good, understand the quality of the pitcher too. Not all pitchers are the same. Your elite pitchers DO NOT have many if any outlier low games! Example, Shane Bieber GSc72 last season. He did not throw a game under 53! Third, pitchers tend to off set extreme outlier performances more immediately after than gradual. If a pitcher throws a no-hitter for example, he is a great “go against” the next time out. Fourth, pay attention to streaks and compare history. How many consecutive times has this pitcher thrown poorly or well? What is his normal?
We can learn so much from details if we are looking at them. Spotting patterns is your edge on the book! Do not miss your chances to exploit them.
If you like what ECSI offers & potentially like to learn how to join our TEAM & FAMILY, whether app & Back to Basics or our VIP membership. Just click one of the links below or send us an email.
If you DONT like the emails & these are not what your looking for, just UNSUBSCRIBE at bottom of 📄
Twitter @ECSportsInvest
Facebook & IG @eastcoastsportsinvestors
Always INVEST & WAGER Responsibly
Have a great Sunday & Best of Luck📈💵🥂
Jeff Dawson
CEO & Founder


Comments